Reading Charts: Line, Bar, and Candlestick – A Complete Beginner’s Guide
Introduction
Investing can feel intimidating, especially when you first see charts filled with ups and downs. Reading charts—specifically line, bar, and candlestick charts—is a core skill for anyone eager to make informed investment decisions. These charts turn complex data into visual stories, bringing clarity to price movements over time.
If you've ever opened a stock app or sat through a financial video, you’ve likely been confused by charts that seem full of mysterious lines and bars. Don't worry—we’ve all been there! The good news: with a little guidance, you can start reading charts confidently, even if you’re brand new to investing.
What Is Chart Reading?
Reading charts involves identifying and understanding patterns in the price and volume of a security, such as a stock or crypto. Line charts give a simple overview, bar charts add more detail, and candlestick charts provide deeper insight. Together, they offer a visual explanation of how markets behave, helping you spot trends and make better decisions.
Step-by-Step Guide: How to Read Line, Bar, and Candlestick Charts
- Understand Axes and Scale
- X-axis: Shows time (days, months, years).
- Y-axis: Shows price or value of the asset.
- Start with Line Charts
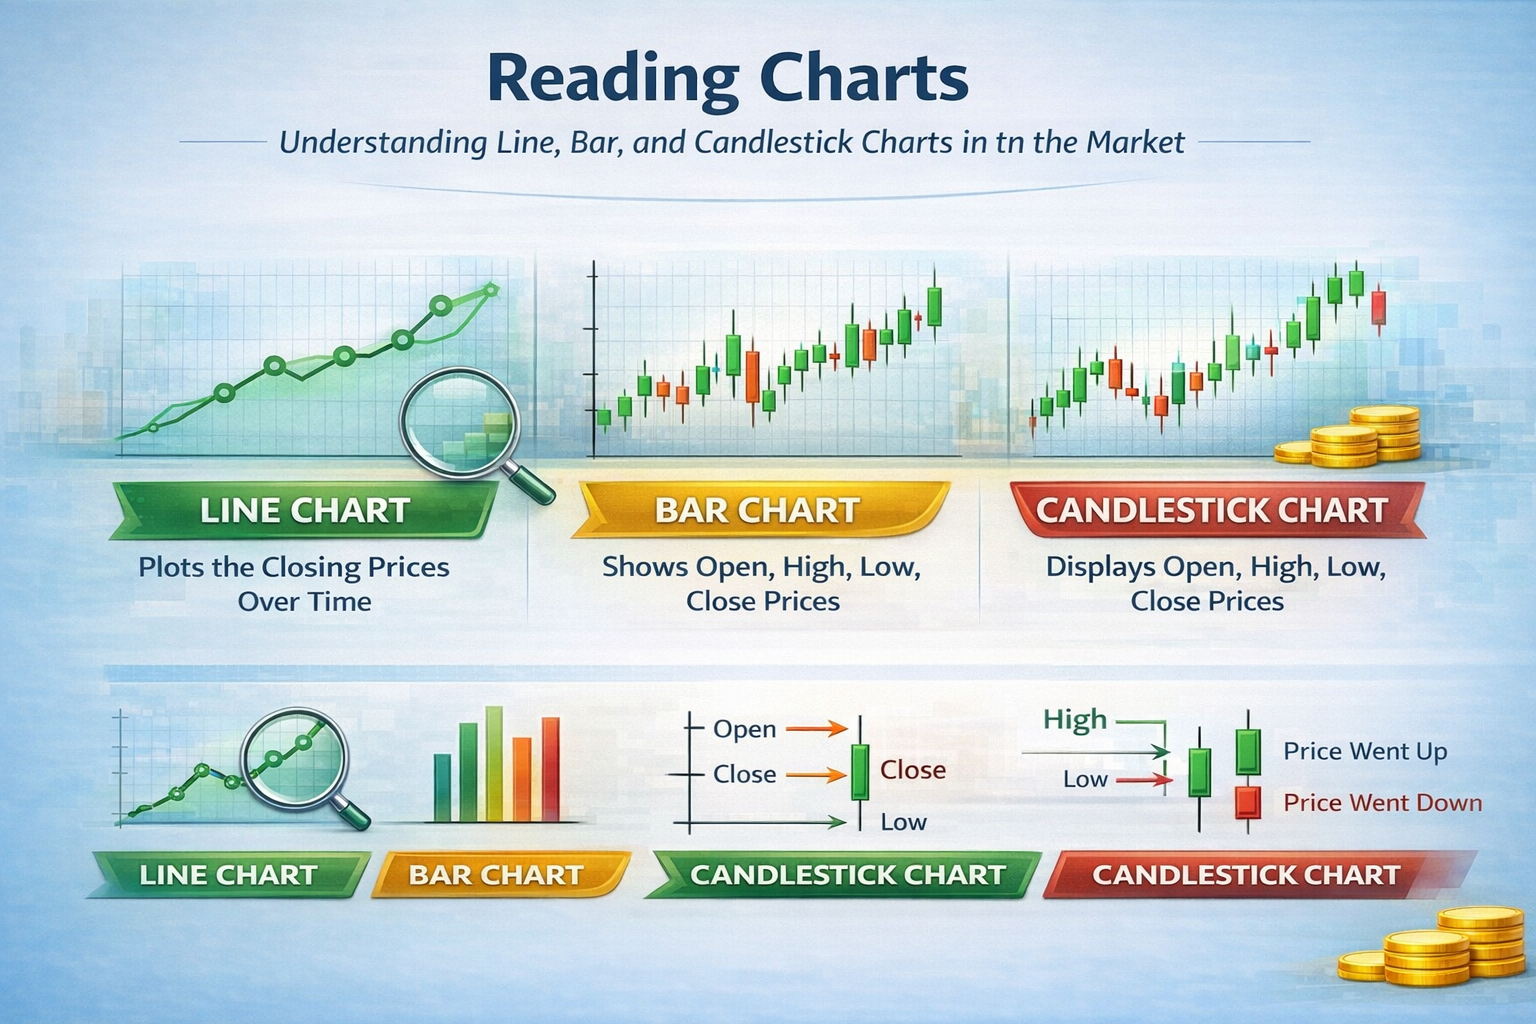
- A line chart connects closing prices over time with a simple line.
- Best for seeing basic price trends—uptrends vs. downtrends.
- Move to Bar Charts
- A bar chart displays each time period as a vertical line with small ticks on each side.
- Left tick marks the "open", right tick marks the "close", and the line shows high and low prices for the period.
- Explore Candlestick Charts
- Candlestick charts look like rectangles (the "candle") with lines above and below (the "wicks").
- Body color shows if the price closed higher (usually green/white) or lower (red/black) than it opened.
- Wicks indicate the range between the highest and lowest prices.
- Identify Patterns and Trends
- Look for consecutive highs or lows—this helps spot a trend direction.
- Chart "patterns" (like head and shoulders, double bottom) can hint at future movements, but take time to learn.
- Use Chart Reading for Decisions
- Compare recent and past movement to gauge whether the asset is trending up or down.
- Combine chart reading with research before buying or selling.
Advantages of Reading Charts
- Helps you visually track asset performance over time.
- Simplifies decision-making; spot overall direction quickly.
- Supports identifying buying and selling opportunities.
- Works for almost any asset: stocks, crypto, commodities, and more.
Disadvantages
- Charts don’t guarantee future results; they show past data.
- Can feel overwhelming; takes patience to learn advanced techniques.
- May lead to over-analyzing, missing the bigger investment picture.
Alternative Investment Options
- Index Funds: Track the market without in-depth analysis; good for beginners.
- Robo-Advisors: Automated platforms that invest based on your goals.
- Mutual Funds: Pool money with others in a fund managed by a professional.
- Dividend Stocks: Focus on regular income, not price movement.
Beginner's Tips for Reading Charts
- Start with line charts to build basic comfort.
- Zoom out to catch big trends before worrying about small details.
- Don't get discouraged by "information overload"—take it one step at a time!
- Practice with free online chart tools (Yahoo Finance, Google Finance, TradingView).
- Remember: no chart is perfect. Combine visual reading with research and planning.
Advanced Variations for Experienced Traders
- Technical Indicators: Tools like moving averages, RSI, or MACD applied directly to charts for deeper analysis.
- Candlestick Patterns: Complex shapes like "Doji," "Hammer," or "Engulfing" that predict short-term moves.
- Multiple Time Frames: Compare daily, weekly, and monthly charts to confirm trends.
- Overlay Volume Data: Analyze how much asset is traded during trend movements.
FAQs
- What is the easiest chart type to start with?
Line charts are the simplest for beginners—just focus on closing prices.
- Are candlestick charts more useful?
They offer the most detail, but need more learning and practice.
- Can I use chart reading for any kind of investment asset?
Yes! Line, bar, and candlestick charts work for stocks, ETFs, crypto, forex, and more.
Conclusion
Reading charts (line, bar, candlestick) can turn confusion into confidence for any investor. Start simple, be patient, and practice as much as you can. Remember, these visual tools are meant to simplify your investment journey, not complicate it. Combine your new skills with smart research, and you'll have a powerful approach to understanding the markets.