Candlestick Basics (Open, High, Low, Close): A Complete Beginner’s Guide
Stock charts can look intimidating at first glance, especially with their colorful bars and strange patterns. The good news? Most financial charts share a common building block—candlestick basics. Understanding candlesticks (open, high, low, close) brings clarity, helping you read market trends and make smarter investment decisions.
If you’re new to stocks, crypto, or forex trading, you might feel lost trying to decode those green and red bars. Don’t worry—once you learn the essentials of candlesticks, you’ll unlock a whole new way of seeing the market!
What Are Candlesticks? (Open, High, Low, Close Explained)
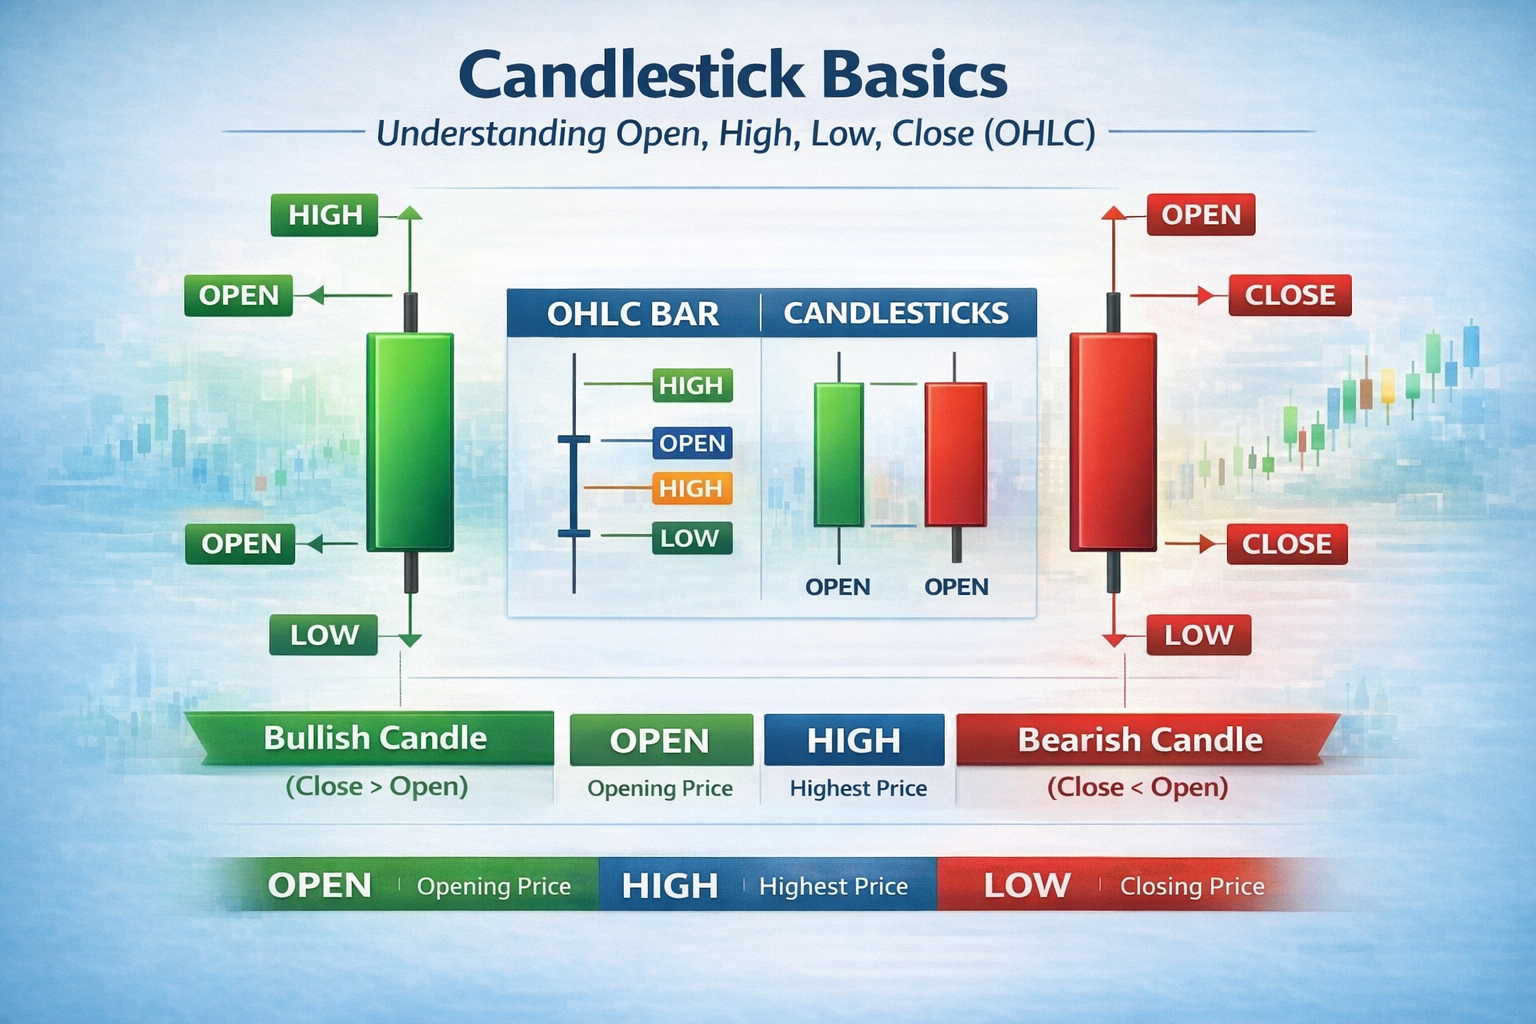
Candlesticks are visual tools traders use to show a market’s price movement within a specific time frame (like one day, one hour, or even one minute). Each candlestick contains four key pieces of information:
- Open: The price when the trading period began
- High: The highest price reached during that time
- Low: The lowest price during the same period
- Close: The final price when the period ended
In essence: Candlestick basics (open, high, low, close) give you a snapshot of how the price “moved” during any given session, making market behavior much easier to understand.
Step-by-Step Guide: How to Read Candlesticks
- Spot the candlestick on your chart. Each 'stick' or 'bar' represents one time period (like 1 day if you’re on a daily chart).
- Identify the “open” and “close.”
- The wide part of the candlestick (the body) shows these two prices.
- If the close is higher than the open, the candle is usually green (price went up).
- If the close is lower than the open, the candle is usually red (price went down).
- Find the “high” and “low.”
- The thin lines above and below the body are called “wicks” or “shadows.”
- The very top of the upper wick = highest price reached.
- The very bottom of the lower wick = lowest price reached.
- Interpret the candlestick’s meaning.
- A long green body = strong buying activity.
- A long red body = strong selling activity.
- Long wicks can mean price tried to move up or down but got pushed back.
- Look for patterns.
- Several candlesticks together can suggest upward (“bullish”) or downward (“bearish”) trends.

Advantages of Candlestick Basics (Open, High, Low, Close)
- Gives an immediate and clear picture of price action
- Helps spot trends, reversals, and potential buy or sell opportunities
- Works for all markets: stocks, cryptocurrencies, forex, and more
- Accessible for beginners but also powerful for advanced traders
- Visual layouts make decision-making less stressful
Disadvantages of Using Candlestick Basics
- Can sometimes lead to “over-reading” meaning into random price moves
- Requires practice to spot real patterns versus noise
- Doesn’t predict the future—just shows past movement
- Works best when combined with other tools (like trend lines or volume)
Alternative Investment Options
- Line Charts: Show only the closing prices over time—simple but less detail.
- Bar Charts: Similar to candlesticks, but visually a bit different with lines instead of filled shapes.
- ETFs and Mutual Funds: For hands-off investors who prefer not to watch charts.
- Robo-Advisors: Automated portfolios for those who want to invest but not trade actively.
Beginner’s Tips for Using Candlestick Basics
- Start by learning one market (stocks, crypto, etc.) before branching out.
- Practice reading candlestick charts with virtual trading apps.
- Don’t trade based on a single candlestick—look for larger patterns.
- Pair candlestick basics (open, high, low, close) with other tools, like moving averages or support/resistance.
- Keep your starting investments small while learning.
Advanced Variations for Experienced Traders
- Candlestick Patterns: Learn names like doji, hammer, engulfing, and shooting star. These signal potential reversals or continuations.
- Heikin-Ashi Candles: A modified version that smooths out noise, great for spotting longer trends.
- Combine with Technical Indicators: Use RSI, MACD, or Bollinger Bands alongside candlestick basics for enhanced analysis.
- Multi-timeframe Analysis: Check candlesticks on different timeframes (like daily and hourly) for deeper insight.
FAQs: Candlestick Basics
What is the main use of candlestick basics (open, high, low, close)?
Candlesticks help you quickly see how prices move within a given period, making it easier to spot trends, reversals, and entry or exit points.
Are candlesticks only for stocks?
No—candlestick basics work for stocks, forex, cryptocurrencies, commodities, and more.
Do I need special software?
Most online brokers and finance websites (like TradingView or Yahoo Finance) offer free candlestick charts.
In summary: Mastering candlestick basics (open, high, low, close) is a stepping stone for any beginner wanting to decode the markets. Use this guide to build your foundation and grow your confidence with every trade.