Introduction
Are you curious about how volume analysis can give you clues about where a stock is headed? Whether you’re a trader, investor, or just learning, understanding what moves the market beyond just price can open new doors for your decision-making skills. The essence of volume analysis lies in clarity: it helps you read the "story" between the price and how many people are buying or selling.
We’ll cover two of the most respected volume-based indicators: On-Balance Volume (OBV) and the Accumulation/Distribution Line. These may sound complex, but stick with us—by the end of this guide, you’ll know exactly how to use them to your advantage!
Ever looked at a stock chart and thought, "I know the price, but why did it really move?" Volume analysis helps answer that question!
What Is Volume Analysis?
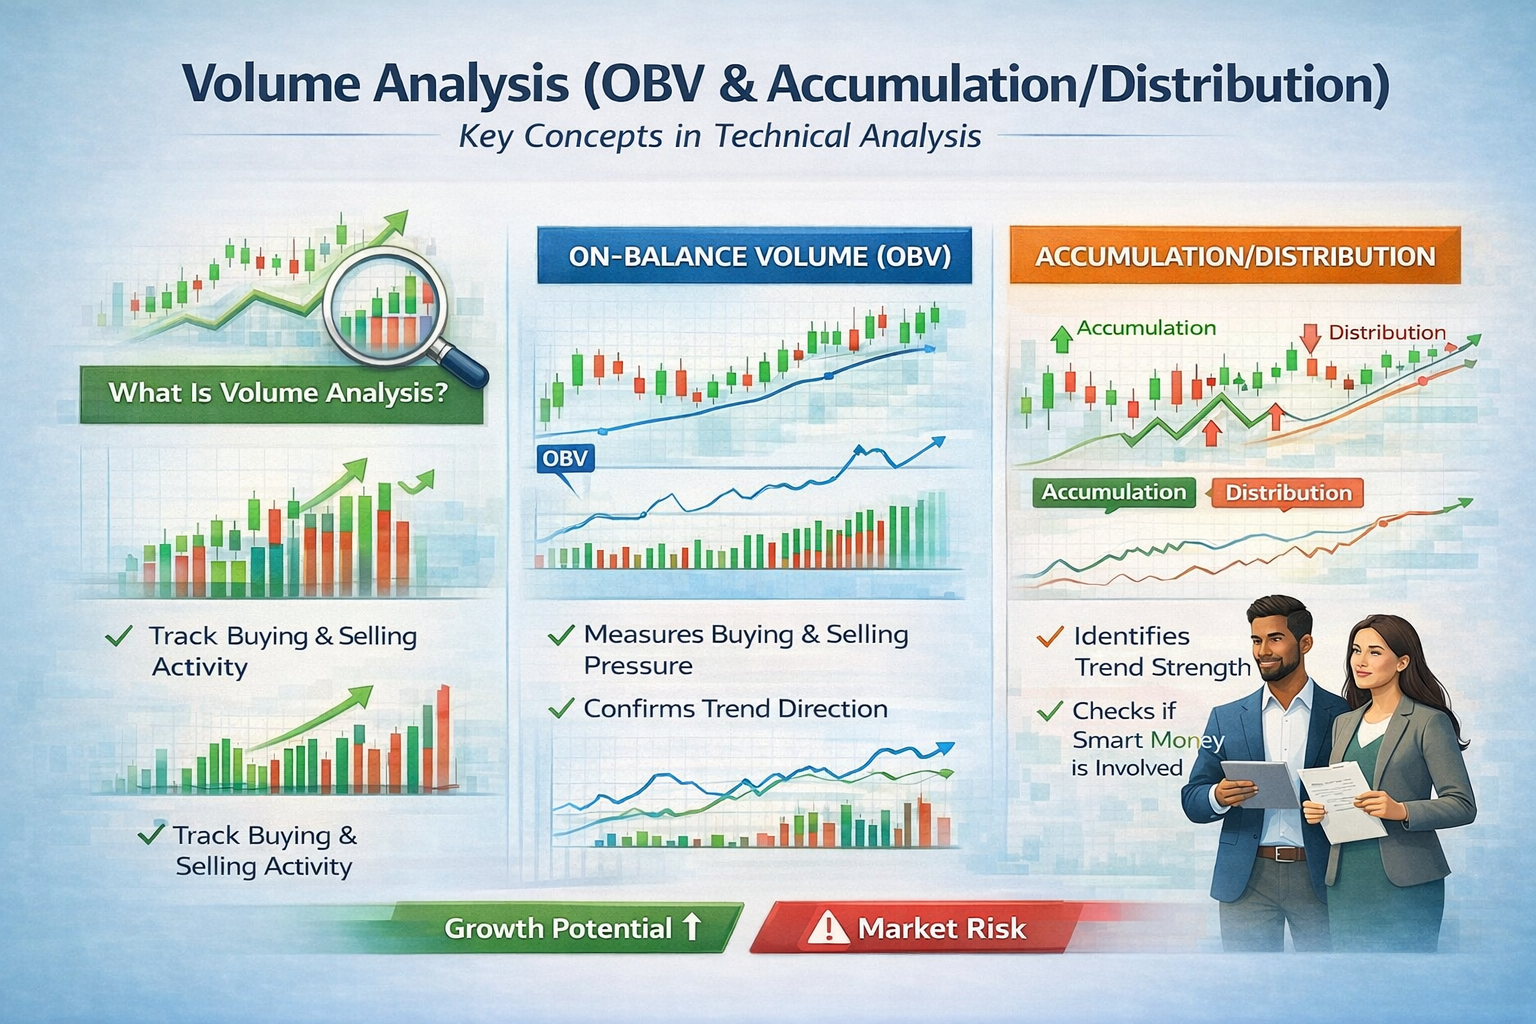
Volume analysis is the study of trading volumes (the number of shares or contracts traded within a given period) and how they relate to price movements. Think of it as the “heartbeat” of the market—helping you understand the strength behind a price move.
- On-Balance Volume (OBV): Tracks buying and selling pressure by adding volume on up days and subtracting it on down days.
- Accumulation/Distribution: Measures the cumulative flow of money into and out of a stock, considering both price and volume.
Essence: Volume analysis gives you clarity on whether a price move is trustworthy or likely to fade.