Support, Resistance, and Trendlines: The Beginner’s Guide to Smarter Trading
Introduction
Navigating financial charts can feel like solving a riddle. Terms like support, resistance, and trendlines often pop up—but what do they really mean for your trading success?
Support, resistance, and trendlines are chart concepts that help you find clarity amidst the market’s noise, offering simple lines of guidance for your trading decisions.
If you’ve ever wondered why prices repeatedly bounce away from certain levels or why some stocks fall into clear patterns, you’re already glimpsing the power of these basic tools.
What are Support, Resistance, and Trendlines?
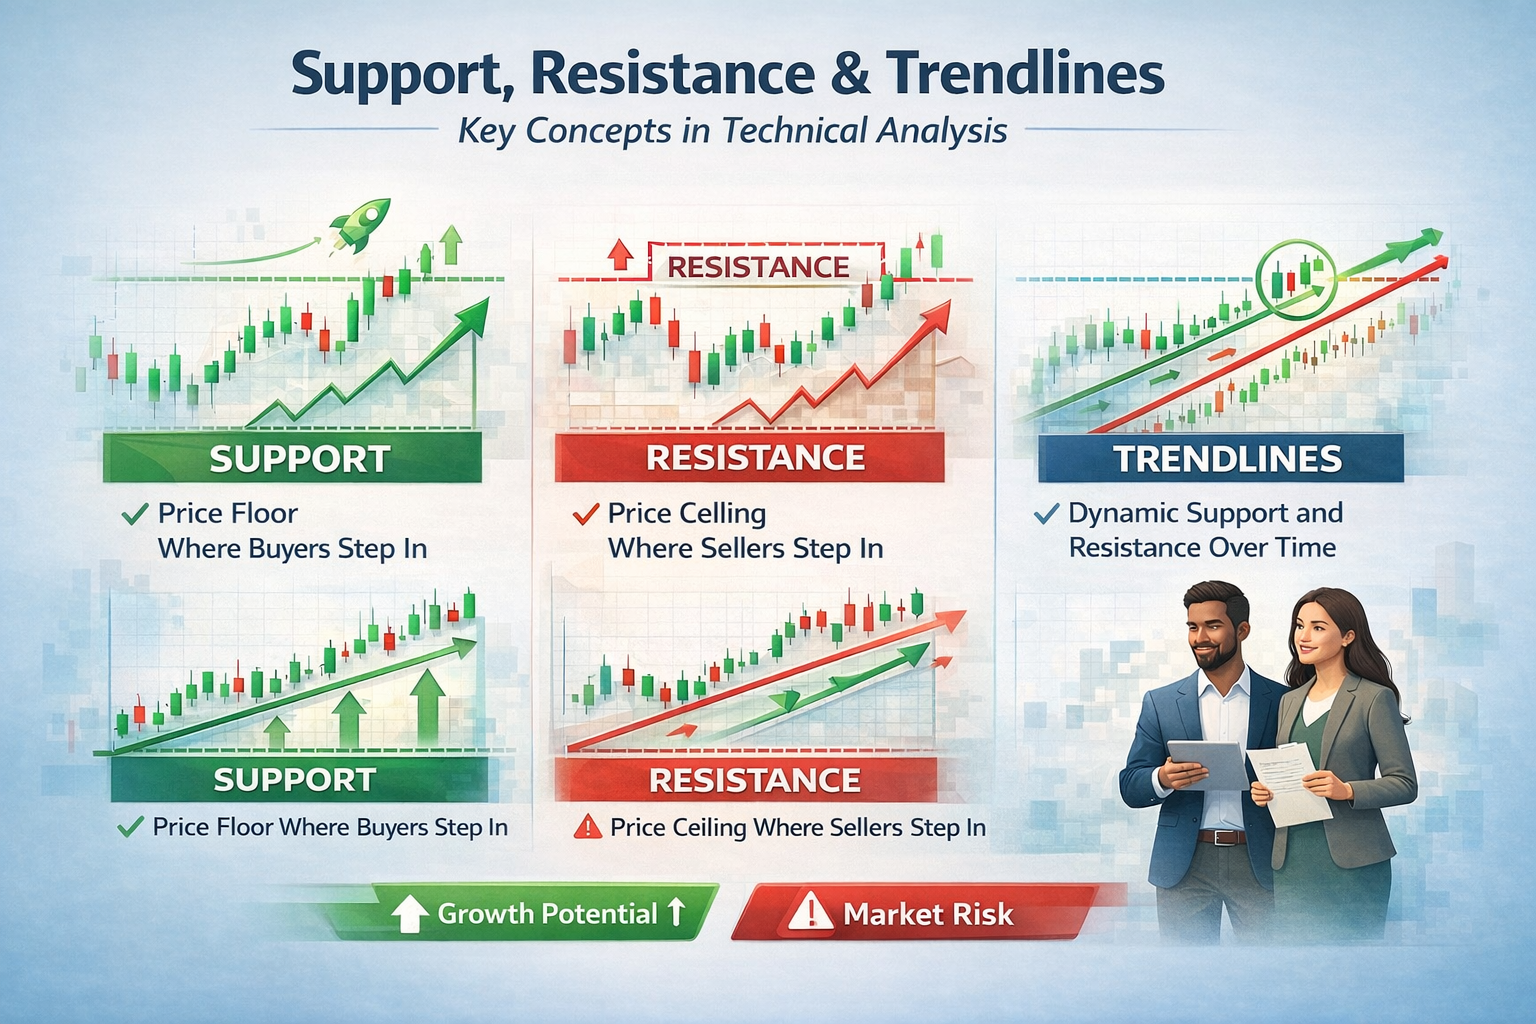
- Support: A price level where a falling stock or asset tends to find buyers—like a floor beneath the price.
- Resistance: A price level where rising prices stall as sellers step in—a ceiling above the price.
- Trendlines: Sloped lines drawn on a chart connecting multiple price points, helping you spot the general direction (trend) the asset is following over time.
At their core, these tools give structure to randomness. They help you identify where the action (buyers or sellers) clusters, so you don’t have to guess blindly.
Beginner’s hook: Have you watched a ping pong ball bouncing off the sides of a table? That’s how prices behave around support and resistance!
Step-by-Step Guide: How to Use Support, Resistance, and Trendlines
- Open a chart
Pick your favorite trading platform or site, and pull up the asset’s price chart (stocks, crypto, forex, etc.).
- Identify swing highs and lows
Look for points where the price keeps bouncing down (swing high) or up (swing low). These are clues for support and resistance.
- Draw your support line
Connect two or more low points with a horizontal or slightly sloped line. This marks the support where buyers are active.
- Draw your resistance line
Connect two or more high points with a line above the price action—the spot where sellers appear.
- Add a trendline
If the price moves steadily higher (bullish) or lower (bearish), draw a diagonal line beneath (for uptrends) or above (for downtrends) the price connecting major lows or highs.
- Use lines for trading decisions
- If the price nears support, it may bounce higher—potential buy signal.
- If the price nears resistance, it may fall—potential sell signal.
- Trendlines show if you should follow a trend or be cautious if the trend is ending.
Advantages of Using Support, Resistance, and Trendlines
- Simple to use—no fancy tools required.
- Helps spot where price reversals or breakouts may happen.
- Works in almost any market: stocks, cryptocurrencies, forex, and more.
- Can reduce emotional, impulsive trading by providing visual guideposts.
Disadvantages
- Not always precise—lines are more like zones than exact points.
- The market can break through support or resistance unexpectedly, leading to “false signals.”
- Requires practice; lines drawn by different people may vary.
Alternative Investment Options
If drawing lines and reading charts feels overwhelming or isn’t your style, consider these options:
- Robo-advisors: Automated platforms that manage investments for you.
- Index funds: Simple, broad-market funds needing no technical analysis.
- Dollar-cost averaging: Invest a fixed amount at regular intervals, regardless of price.
- Dividend investing: Focus on stocks that pay regular income.
Beginner’s Tips
- Practice drawing lines on free charting tools before trading real money.
- Don’t rely on a single support or resistance—look for areas where price interacts multiple times.
- Combine with other simple tools, like volume or moving averages, for confirmation.
- Remember, even experts get it wrong sometimes. Use stop-loss orders to protect yourself.
Advanced Variations for Experienced Traders
- Dynamic support and resistance: Use moving averages as “moving lines.”
- Channels: Draw parallel trendlines above and below price for defined upside/downside targets.
- Multiple timeframes: Check support and resistance on daily, weekly, and even monthly charts for stronger zones.
- Fibonacci retracements: Add mathematical levels between highs and lows for extra potential reversal spots.
FAQs: Support, Resistance, and Trendlines
- Q: Can support and resistance levels change?
A: Yes, as new highs and lows form, these levels shift—markets are dynamic.
- Q: Do support, resistance, and trendlines work for crypto?
A: Absolutely! These principles work for most assets with charts and price history.
- Q: How often are trendlines accurate?
A: No line is perfect, but they offer probabilities and context—not guarantees.
Conclusion
Support, resistance, and trendlines give you a powerful way to read between the lines of noisy charts. They’re simple, visual, and bring structure to trading decisions—just remember to stay flexible, keep practicing, and combine them with other tools for best results.