Moving Averages (SMA, EMA): The Complete Beginner's Guide
Introduction
Ever stared at a stock chart and wondered, "How do I spot the real trend?" If so, you're not alone. Enter moving averages (SMA, EMA)—simple yet powerful tools that help traders see the bigger picture by smoothing out daily price noise. Their essence is clarity: moving averages reveal the true direction of a market, so you make smarter decisions.
If you're new to trading, moving averages might seem confusing. But imagine them as lines that sum up the mood of the market over days or weeks—helping you see when it’s time to act, or when to wait.
Step-by-Step Guide: Using Moving Averages (SMA, EMA)
- Choose Your Moving Average
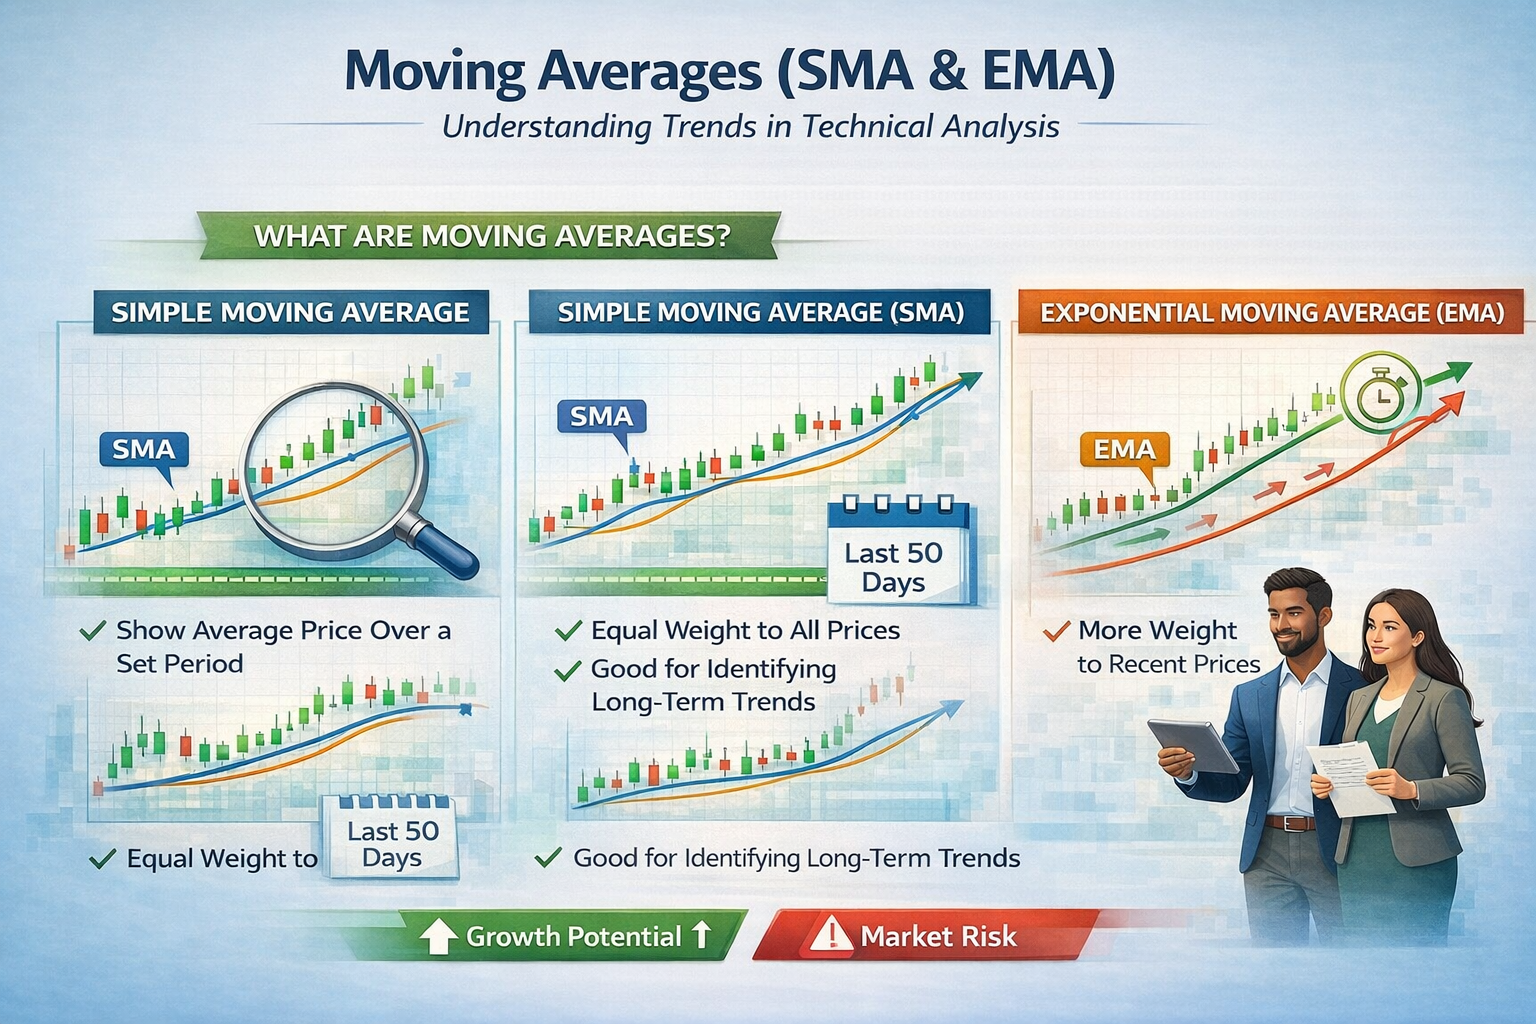
There are two main types: Simple Moving Average (SMA) and Exponential Moving Average (EMA).
- SMA: Averages closing prices over a set number of days (e.g., 10 days).
- EMA: Similar but gives more weight to recent prices, making it quicker to react to price changes.
- Pick a Time Period
The period could be 10, 20, 50, or 200 days—each has its use. For example, a 200-day moving average shows the long-term trend, while a 20-day is more short-term.
- Add to Your Chart
Use charting software or stock platforms to plot the SMA or EMA. Just search for the "moving average" indicator, choose your type and period.
- Observe the Trend
- If price is above the moving average, the trend may be up.
- If price is below, the trend may be down.
- Look for Crossovers
Many traders watch when a short-term moving average crosses over a long-term one (like the 20-day crossing the 50-day)—these "crossovers" often signal potential buying or selling moments.
Breaking Down Moving Averages
- Simple Moving Average (SMA): Useful for a broad, balanced view. Each day's price affects the average equally.
- Exponential Moving Average (EMA): Reacts more quickly to price changes, as recent days count more. Good for faster trend spotting.
- Moving averages work best in trending markets. In choppy, sideways markets, signals can be less reliable.
Advantages of Moving Averages (SMA, EMA)
- Simplicity: Easy for beginners to start using right away.
- Clarity: Smooths out volatile price action and highlights the overall direction.
- Versatile: Works on stocks, crypto, forex—nearly any financial market.
- Objective: Removes emotional guesswork from trading decisions.
Disadvantages of Moving Averages
- Lagging Indicator: They rely on past prices, so signals can sometimes be late, especially after big news events.
- False Signals: In sideways markets, moving averages can trigger "whipsaws"—giving buy or sell signals that don’t last.
- Over-reliance: Relying only on moving averages may miss out on more nuanced market factors.
Alternative Investment Options
- Relative Strength Index (RSI): Looks at speed and change of price movements—a favorite for spotting overbought/oversold assets.
- MACD (Moving Average Convergence Divergence): Combines moving averages for sharper buy/sell signals.
- Buy-and-Hold Investing: For those preferring less active management, simply investing in an index fund and holding can also yield returns over time.
Beginner’s Tips
- Start with the simple moving average (SMA) on daily or weekly charts before trying the EMA.
- Don’t use moving averages alone: add another indicator (like RSI) for more confidence.
- Practice first: Use a demo or practice account.
- Remember that moving averages don't predict the future—they are tools to help you interpret trends.
Advanced Variations for Experienced Traders
- Multiple Moving Average Crossovers: Use combinations (e.g., 20, 50, and 200-day) for complex strategies like the "golden cross" (a bullish long-term sign) or "death cross" (bearish).
- Adaptive Moving Averages: Indicators like the Hull Moving Average or KAMA adjust their smoothness based on market conditions.
- Moving Average Envelopes: Trade within upper and lower bands relative to a moving average for advanced strategies.
Frequently Asked Questions (FAQ) on Moving Averages
What’s the difference between SMA and EMA?
SMA gives equal weight to all days in the period. EMA reacts faster to recent prices, which is helpful in fast-moving markets.
Should I use a short or long moving average?
Short ones (like 10-day or 20-day) are good for quick trades. Long ones (like 200-day) help spot big-picture trends.
Can moving averages predict stock prices?
No—they help spot trends, but don’t predict future prices!
How many moving averages should I use?
Start with one or two; experiment to see what fits your trading style.
Conclusion
Moving averages (SMA & EMA) are simple, reliable tools that help traders filter the noise and see real market trends. By understanding how to use them, both beginners and experienced investors can make more thoughtful, less emotional decisions. Remember: practice, combine with other tools, and always be patient. Happy trading!