Momentum Indicators (RSI, MACD): The Complete Beginner's Guide
Introduction
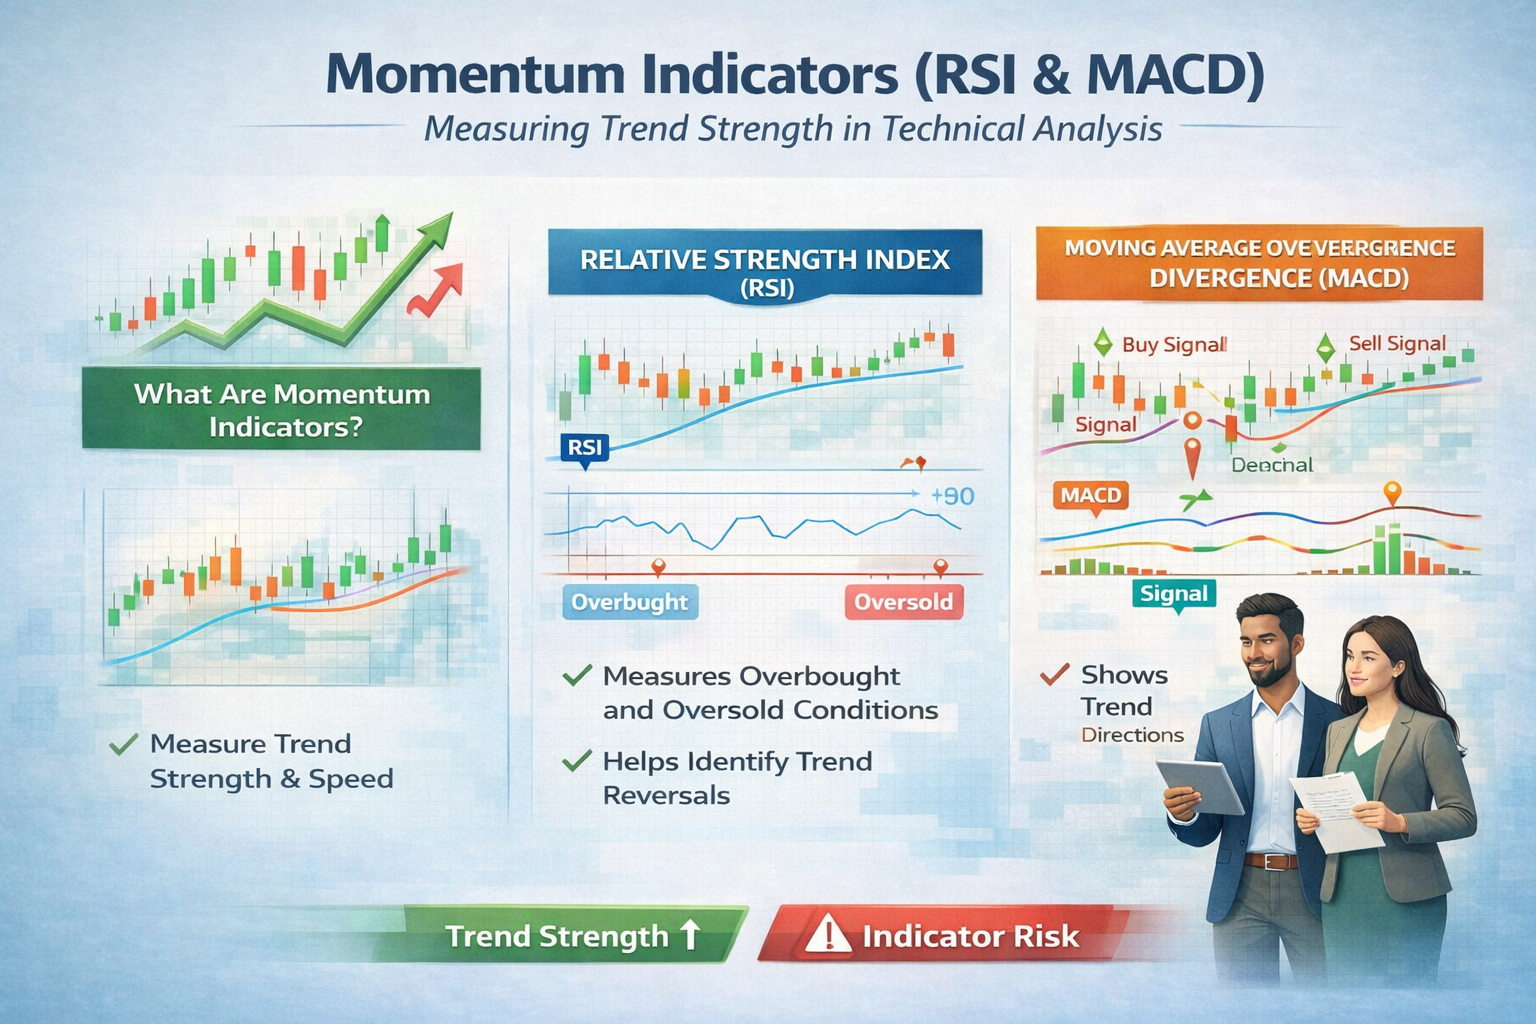
Momentum indicators are powerful tools in technical analysis, designed to help traders measure the speed and direction of price movements. Two of the most popular momentum indicators are the Relative Strength Index (RSI) and the Moving Average Convergence Divergence (MACD).
In essence, momentum indicators offer clarity on whether a stock or asset is overbought, oversold, or trending strongly—helping you make smarter trading decisions.
Have you ever watched prices swing up and down, unsure when to enter or exit a trade? If so, you're not alone! Many beginners find momentum indicators like RSI and MACD especially helpful for timing the market and avoiding those dreaded “buy high, sell low” mistakes.
Step-by-Step Guide to Using Momentum Indicators
- Choose Your Indicator:
- RSI: Measures recent price changes on a scale from 0 to 100.
- MACD: Shows the relationship between two moving averages, highlighting trend direction and momentum.
- Set Up Your Chart:
- Open your trading platform (like TradingView, Yahoo Finance, or your broker’s platform).
- Find the option to add indicators—type in “RSI” or “MACD.”
- Read the RSI:
- An RSI above 70: Asset may be overbought (possible price drop).
- An RSI below 30: Asset may be oversold (possible price bounce).
- Understand the MACD:
- Look at the MACD line crossing above the Signal line – this could mean a buy opportunity.
- MACD crossing below the Signal line – could signal a sell opportunity.
- Watch for a “divergence” (where the price and MACD move in opposite directions) as an early trend-change sign.
- Take Action:
- Combine indicator signals with other research (news, support/resistance levels).
- Always test your strategy with a demo account first!
Breaking Down Momentum Indicators
RSI (Relative Strength Index): The RSI is a momentum indicator that signals if an asset has been overbought (possibly “too expensive”) or oversold (possibly “too cheap”) within a recent time frame, usually 14 days.
- Value above 70: Overbought
- Value below 30: Oversold
MACD (Moving Average Convergence Divergence): The MACD helps traders spot changes in the strength, direction, momentum, and duration of a trend by comparing two exponential moving averages (typically 12 and 26 periods).
- MACD Line crossing Signal Line from below: May suggest a bullish (upward) move.
- MACD Line crossing Signal Line from above: May suggest a bearish (downward) move.
Advantages of Momentum Indicators (RSI, MACD)
- Easy for beginners to understand and use.
- Works across different markets (stocks, forex, crypto, and more).
- Helps filter out market “noise” and focus on real trends.
- Provides clear signals on overbought/oversold conditions.
- Aids in timing entries and exits.
Disadvantages of Momentum Indicators
- Can produce false signals, especially in sideways or “choppy” markets.
- Should not be used alone—work best with other indicators or research.
- Lagging nature: They may react to price action after a move has already started.
Alternative Investment Options
- Fundamental Investing: Focus on company earnings, news, and growth potential instead of charts.
- ETFs & Index Funds: Invest in diversified baskets of stocks—great for long-term growth with less need for technical analysis.
- Dividend Stocks: Choose stable companies that pay regular income, ideal for more passive investors.
Beginner’s Tips for RSI & MACD
- Always combine RSI or MACD with other tools (like volume or support/resistance levels).
- Practice with a free “paper trading” or demo account—no real money at risk.
- Avoid trading based only on one signal; confirm with multiple indicators.
- Set clear stop-loss and take-profit points before entering a trade.
- Keep a trading journal to review your progress.
Advanced Variations for Experienced Traders
- RSI Divergence:
- Bullish divergence: Price makes a new low, but RSI makes a higher low—potential reversal.
- Bearish divergence: Price makes a new high, RSI makes a lower high—watch for a drop.
- MACD Histogram Analysis:
- Monitor the histogram bars for early signals of momentum change.
- Multiple Time Frame Analysis:
- Look at RSI and MACD on daily, weekly, and hourly charts for a more complete view.
FAQs about Momentum Indicators (RSI & MACD)
What are the best settings for RSI and MACD?
Standard RSI is 14 periods; MACD commonly uses 12, 26, and 9 periods. You can adjust these to fit your strategy, but start with the default settings before experimenting.
Can I use RSI and MACD together?
Yes! Many traders combine both indicators for extra confirmation before making a trade.
Do momentum indicators work for crypto and forex?
Absolutely. RSI and MACD are popular in all liquid markets—stocks, crypto, forex, and more.
Remember: No indicator is perfect. Always do your research, manage your risk, and never trade money you can’t afford to lose.
By understanding momentum indicators like RSI and MACD, you’re one step closer to becoming a more informed, confident trader!