Earnings, EPS, PE Ratio, Price-to-Sales, and Price-to-Book: An Empathetic Beginner's Guide
Introduction
Navigating the stock market can initially seem overwhelming due to the sheer volume of metrics and financial terms like earnings, EPS, PE ratio, price-to-sales, and price-to-book. These indicators are essential for making smart investment decisions and quickly sizing up a company's financial health.
The essence? These financial measurements provide clarity about a company's value, performance, and potential risks. Think of them as your financial compass—guiding you towards smarter, more confident investing!
If you're a beginner, imagine you’re buying a used car: you wouldn’t just look at the price—you’d check the car’s history, mileage, and condition. Similarly, these numbers help you look “under the hood” of any company stock.
Step-by-Step Guide: Breaking Down Each Metric
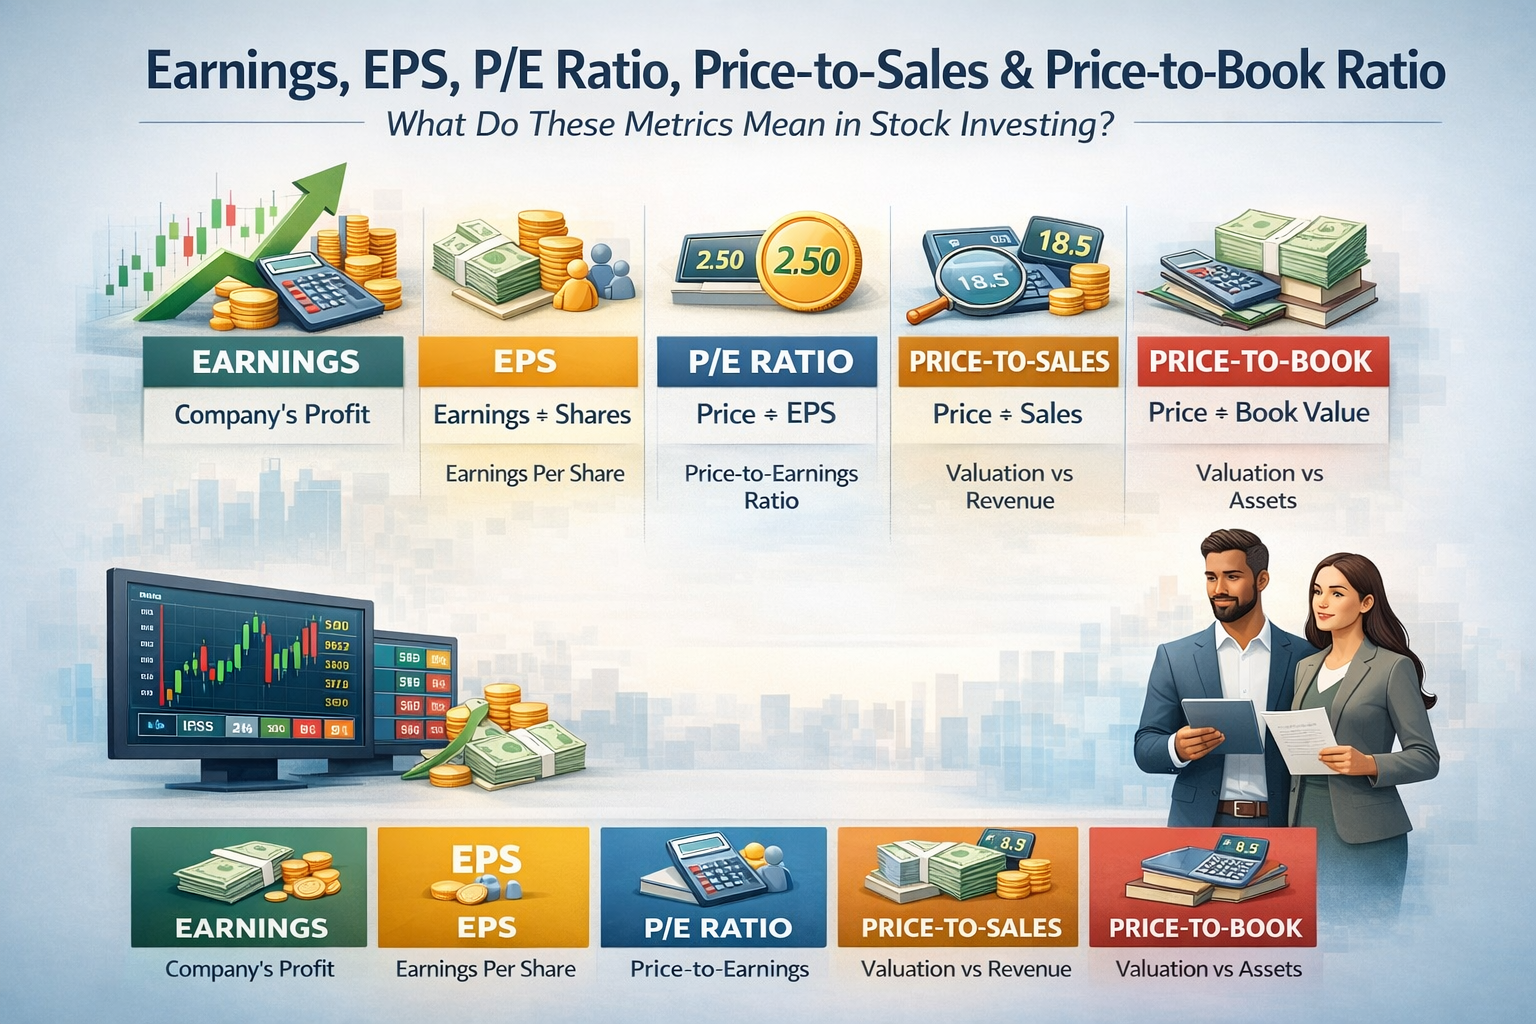
- Earnings (Net Income):
- What it is: The total profit a company makes after subtracting all expenses, taxes, and costs.
- Why it matters: Robust earnings show a company's ability to grow and pay dividends, indicating stability.
- EPS (Earnings Per Share):
- What it is: EPS = Total Earnings ÷ Number of outstanding shares.
- Why it matters: EPS lets you measure the profit earned for every individual share—helpful for comparing companies!
- PE Ratio (Price-to-Earnings):
- What it is: PE Ratio = Price per share ÷ Earnings per share.
- Why it matters: It shows how much investors are willing to pay for $1 of earnings. A high PE could mean a stock is overvalued—or that investors expect growth.
- Price-to-Sales Ratio (P/S):
- What it is: P/S Ratio = Market cap ÷ Total sales (or Price per share ÷ Sales per share).
- Why it matters: Helpful for companies that are not yet profitable—shows how much you’re paying for each dollar of sales.
- Price-to-Book Ratio (P/B):
- What it is: P/B Ratio = Price per share ÷ Book value per share (assets minus debt).
- Why it matters: This tells you if a company’s stock is undervalued or overvalued compared to what it actually owns.
Detailed Breakdown: How to Use Earnings, EPS, PE Ratio, Price-to-Sales, and Price-to-Book
- Start by checking earnings—profitability is key for long-term potential.
- Look at EPS for per-share performance—crucial for apples-to-apples comparisons.
- Compare the PE ratio with competitors and market averages to gauge valuation.
- Use price-to-sales for newer or high-growth companies where earnings might be inconsistent.
- Check price-to-book for asset-heavy businesses (like banks or manufacturers).
Advantages
- Objective Comparison: These metrics let you compare companies of different sizes and industries.
- Simple Snapshot: Quick way to scan financial health, growth, and risk without deep accounting knowledge.
- Decision Support: Helps you avoid overpaying or overlooking hidden value in stocks.
Disadvantages
- Doesn’t Tell the Whole Story: Numbers alone don’t reflect management quality, future strategies, or market trends.
- Can Be Distorted: Earnings and ratios can be manipulated with creative accounting.
- Not Always Useful Across Sectors: Metrics like PE ratio might not work well for companies with negative earnings or high growth phases.
Alternative Investment Options
- Index Funds and ETFs: Diversify automatically, requiring less stock-picking knowledge.
- Mutual Funds: Managed by finance professionals, which lowers the need for individual analysis.
- Robo-Advisors: Automated investing platforms that make decisions based on your risk profile.
Beginner’s Tips
- Don’t rely on just one metric—blend them for a more accurate picture.
- Always compare ratios with peers in the same industry.
- Look for long-term trends, not just one-year snapshots.
- Use free tools like Yahoo Finance or Google Finance to check company ratios.
- Stay patient—investing is a marathon, not a sprint!
Advanced Techniques for Experienced Traders
- Combine Metrics with Technical Analysis: Use charts and trends together with PE, P/B, and P/S.
- Factor Investing: Build a portfolio around stocks with favorable value metrics (low PE, low P/B, etc.).
- Screen for Outliers: Use screening tools to find undervalued or overvalued companies quickly.
- Look at PEG Ratio: This adjusts PE ratio for growth, giving a more complete valuation picture.
FAQs about Earnings, EPS, PE Ratio, Price-to-Sales, and Price-to-Book
- Q: What is a good PE ratio?
A: It depends on the industry—compare companies in the same sector. In general, a lower PE may indicate undervaluation.
- Q: Can I trust earnings numbers?
A: Mostly, yes, but always check other factors as earnings can be adjusted by accounting rules.
- Q: How do I find these ratios?
A: Sites like Yahoo Finance, Google Finance, and most brokerage platforms display them for free.
- Q: Do I need to know all these before buying stocks?
A: While not mandatory, knowing earnings, EPS, PE ratio, price-to-sales, and price-to-book will make you a more informed and confident investor.